
Optimizing the production of green hydrogen and green electricity (part 1) – Dr. Julio C. Garcia-Navarro.
Today is an auspicious day of the month: it is (at the time of writing) November 23rd. For those of you who are too young or too uninvested in basketball, 23 was the number on the jersey of the greatest basketball player of all time: Michael Jordan (to Lebron’s fans: come at me; I will be waiting). Today felt like a good day to talk about hydrogen.
The past months I have been giving lectures to Russian academics and West-European university students about hydrogen and how it can change the world energy trade. One of the key messages of my lecture is that it is important to decarbonize coal, oil, and gas because they represent at least 70% of the world’s energy consumption, but it is equally important to decarbonize electricity because electricity is also a major source of carbon emissions in the world.
According to the IEA’s Net Zero by 2050 roadmap, the share of RES (renewable energy system) in the total energy consumption should be 20% by 2050, a 4-fold increase with respect to today’s share of 5% (https://www.iea.org/reports/net-zero-by-2050?mc). One of the main disadvantages of today’s excitement about green hydrogen is the fact that people are forgetting that we also need the electricity from wind and solar, not only the hydrogen.
🔥 What about we co-host a webinar? Let's educate, captivate, and convert the hydrogen economy!
Hydrogen Central is the global go-to online magazine for the hydrogen economy, we can help you host impactful webinars that become a global reference on your topic and are an evergreen source of leads. Click here to request more details
For example, in the Netherlands there are advanced talks about getting at the forefront of worldwide green hydrogen production, partly because of the 2030 ambition to have 3.5 GW of electrolysis capacity installed and because of projects such as the Maasvlakte 2. There is a lot of excitement about accelerating the deployment of offshore wind in the North Sea just to produce hydrogen off-grid and transport the hydrogen back to shore using pipelines, which makes sense since working this way avoids the high costs of developing offshore electricity transmission infrastructure. What doesn’t make sense (in my opinion) is that before the hydrogen excitement, the Netherlands was doing very little to decarbonize its electricity production.
According to the EEA (European Environment Agency), the carbon emissions of the Dutch electricity market are significantly higher than the average in Europe: 328 g CO2/kWh for NL with respect to 231 g CO2/kWh for EU-27, representing a 42% above the EU-27 average. According to ENTSO-E (the European Network of Transmission System Operators for Electricity), the average carbon intensity in NL is even higher: 479 g CO2/kWh. We need the green hydrogen, but at the same time we also need to bring down the emissions of the electricity in NL to the levels of Norway (30 g CO2/kWh), Sweden (46 g CO2/kWh) or at least France (100 g CO2/kWh).
In this regard I asked myself: does it make sense to pet two dogs with the same hand (we shouldn’t be killing birds even in metaphors, I think) i.e., to co-generate hydrogen and electricity from a RES installation? To answer this, I opened up an Excel sheet and started to do some calculations.
How much green hydrogen can we produce in a renewable energy installation?
Assume that we have a load profile of offshore wind or solar PV as per figure 1. As we all know, a RES doesn’t produce its rated power all the time (due to the capacity factor) and, in the case of solar PV, it barely reaches its rated power at all in a given year. If we install an EL (electrolyzer) with the primary idea to produce hydrogen, an EL connected to an RES will be given preference when operating i.e., any surplus of electricity could be available for feeding into the electricity grid.
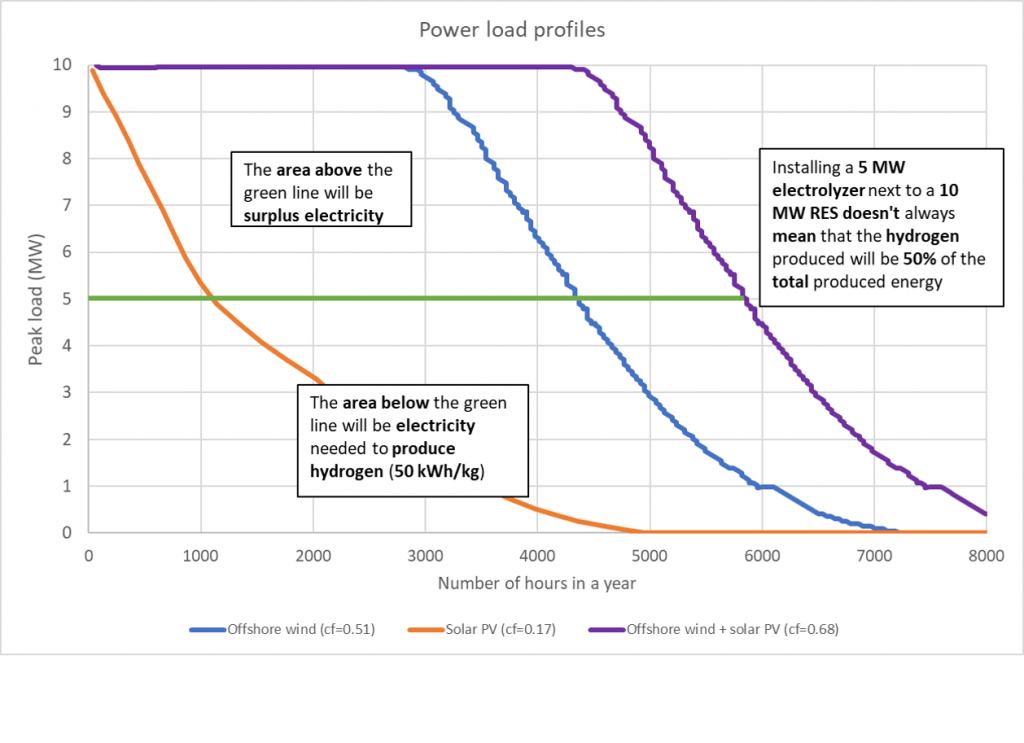
Therefore, if we connect e.g., a 10 MWp RES with a 5 MWp EL (thus with a ratio of RES:EL of 2:1), will the system produce a 50:50 split of hydrogen and electricity? Not at all: if we have a 5 MWp EL and a solar PV array is producing 6.5 MW in September, then 5 MW of power will go to the EL while 1.5 MW will be available as surplus electricity. I added a green line to figure 1 to illustrate my point: the “area under the curve” of the green line (which represents a 5 MWp EL system) is equal to the amount of electricity produced from a 10 MWp RES that will be used in a 5 MWp EL to produce hydrogen each year, and the “area above the curve” of the green line will be surplus electricity available to feed into the electricity grid. Judging by purely looking at figure 1, it looks like for solar PV the area under the curve is significantly larger than the area above the curve, while the areas look a bit more similar for offshore wind (due to the fact that offshore wind has more hours operating at rated power).
I worked out the calculation to find the numbers you can see on the table below. If we connect a 5 MWp EL to a 10 MWp offshore wind installation, the total hydrogen produced would be roughly 60% of the total possible hydrogen production if we had installed a 10 MWp EL. For solar PV this is significantly more: a 5 MWp EL already produces 84% of the total amount of hydrogen that could be produced off a 10 MWp EL, meaning that we would be paying for double the electrolyzer CAPEX only to profit from 16% more hydrogen production (40% more in the case of offshore wind). It is difficult to reach this conclusion while doing this calculation solely using the capacity factor number: you really need the production profile to find out that it is sometimes not the most optimal to connect a 10 MWp RES to a 10 MWp EL system.
| Energy production using a 10 MWp installation | Offshore wind | PV power | Offshore wind + PV power | |||
| tonne H2-eq/year (1 ton H2 = 50 MWh) | Electricity | H2 | Electricity | H2 | Electricity | H2 |
| Pure electricity production (0 MW EL) | 897 | 0 | 294 | 0 | 1194 | 0 |
| Pure H2 production (10 MW EL) | 0 | 897 | 0 | 294 | 0 | 1194 |
| 2:1 RES: EL ratio (5 MW EL) | 365 | 532 | 48 | 246 | 513 | 681 |
| %H2 production using a 2:1 RES:EL capacity ratio | 41% | 59% | 16% | 84% | 43% | 57% |
An interesting take is the case of a system that has offshore wind and solar PV. Assuming that the load profiles of offshore wind and solar PV are complementary, meaning that the peak power production of offshore wind is during the night while the peak production from solar PV is during the day (so their capacity factors can be added up), the share of hydrogen production coming from a 5 MWp electrolyzer connected to a 10 MWp offshore + solar PV installation would actually come closer to an even 50% split of hydrogen and electricity. What does this mean? It is open to interpretation, but my two cents are here: if we can come closer to an even split of hydrogen and electricity, it would be possible to have a RES:EL ratio of 1:1 and make it economically feasible to have completely off-grid installations that only produce green hydrogen at the lowest cost possible.
A scenario where the goal is to maximize the production of hydrogen would be advantageous to an installation aiming solely at selling the hydrogen. Since we want the green electricity as well, it is perfectly fine to have a business case where hydrogen and electricity are sold simultaneously. The profitability of such business case would depend to some extent on the development of the electricity prices over time as well as on the cost-down of RES+EL systems towards 2030 and beyond. The economics of the examples I presented here will be the subject of part 2 of this article (that otherwise would have been too long if kept in a single article).
Hydrogen has the potential to revolutionize our economy in a sustainable way and it is possible that hydrogen brings us back to the path of net zero by 2050. While being excited about hydrogen, we should not forget that our electricity also needs to be green.
Dr. Julio C. Garcia-Navarro
Do places with lots of sun and offshore wind exist anywhere in the world?
This is a tricky question. It is difficult to find places where we can find both energy sources at their highest potentials. That being said, we can have a quick look at the Global Solar Atlas and the Global Wind Atlas to try and identify potential places with lots of solar and lots of offshore wind potential (even if they are not the local maximum for both). A quick glance at the figure below tells me that we the following are some areas of interest for RES+EL installations:
- South-West Africa (e.g., Namibia)
- Western US (Northern California/Oregon)
- The entire Southern coast of Australia
- Morocco
- North-West Spain (Galicia)
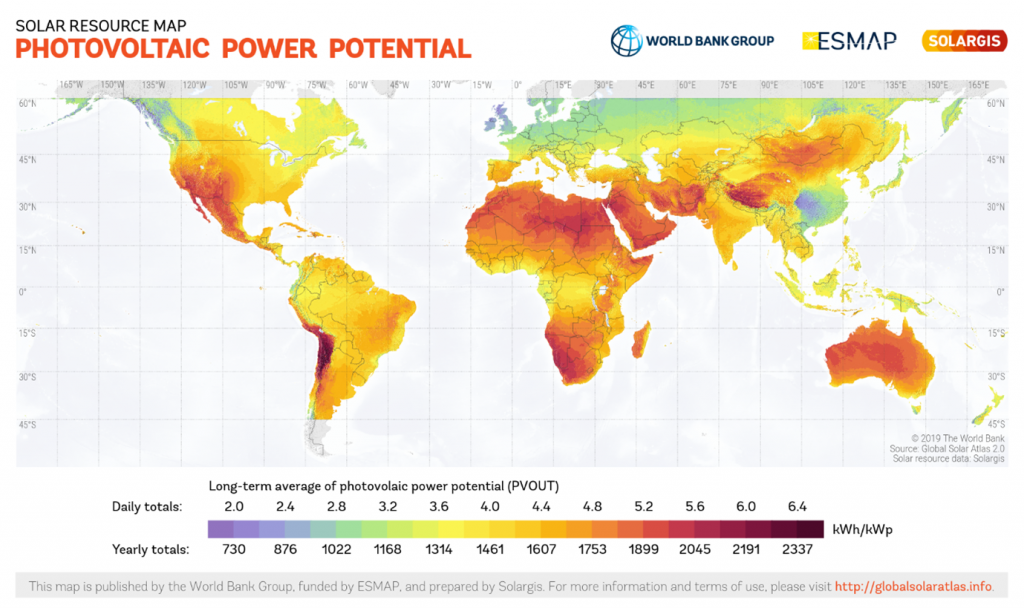

Figure 2. (Top) Photovoltaic power potential. (Bottom) Wind power density potential. Sources: Global Solar Atlas and Global Wind Atlas.
Optimizing the production of green hydrogen and green electricity (part 1) – Bottom line
Decarbonization is not easy. We haven’t done enough to be in the path of net zero by 2050 and, at our current rates, it will be difficult to bring us back to the path. Hydrogen has the potential to revolutionize our economy in a sustainable way and it is possible that hydrogen brings us to the path of net zero by 2050. While being excited about hydrogen, we should not forget that our electricity also needs to be green. There is a way of having green hydrogen and green electricity by thinking of the energy system as a whole instead of developing tunnel vision that will only lead us half of the way.
READ the latest news shaping the hydrogen market at Hydrogen Central
About the author
Dr. Julio C. Garcia-Navarro is a Hydrogen Project Coordinator at New Energy Coalition. He has worked in the hydrogen industry for nearly a decade, on topics such as hydrogen electrolysis, compression, and transportation. Besides hydrogen, he is passionate about Renewable Energy Systems and the Internet of Things.
Copyright © Hydrogen Central. All Rights Reserved.


1 comment